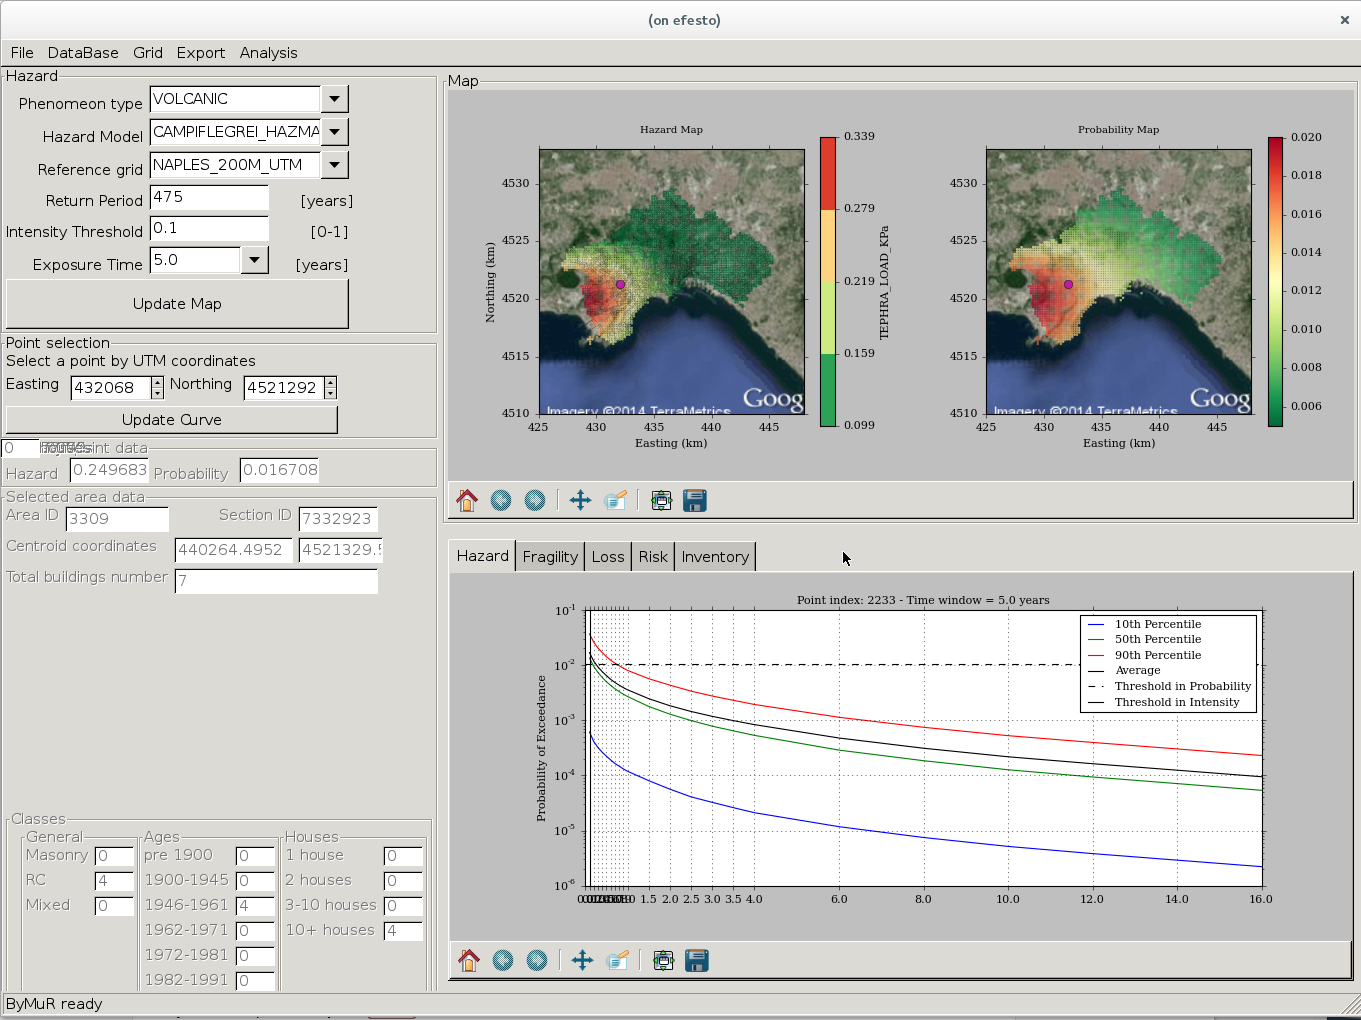
Map visualization
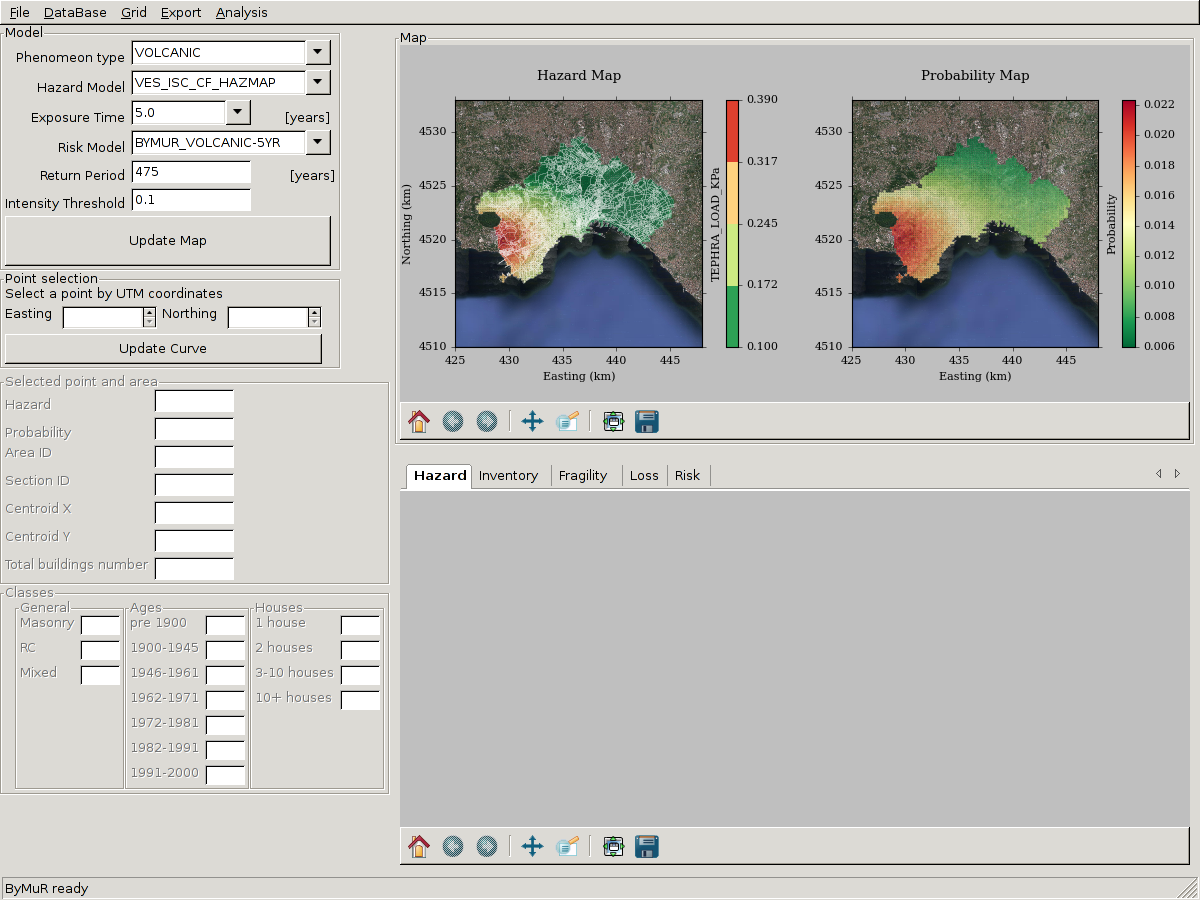
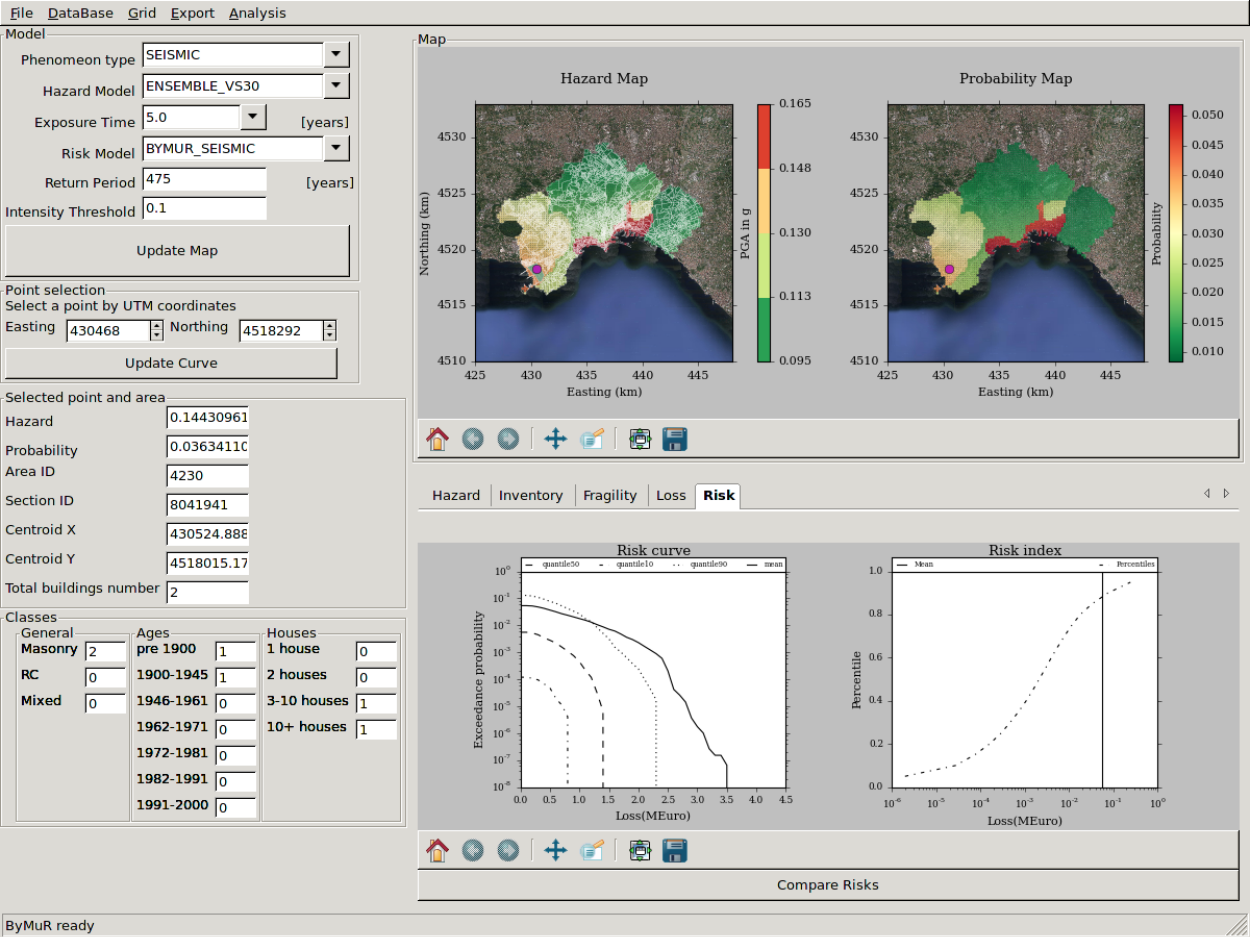
| ByMuR Hazard model selection and visualization. Hazard Map (top left) shows the intensity corresponding to given return period (in the example it is the the amount of tephra load with a return period of 475 years); Probability Map (top right) shows the probability to exceede a given value of the intensity (in the example the intensity threshold is a tephra load of 0.1 KPa). The time window considered is 5 years. On the right panel it is possible to control the parameters to customize the maps. |
To visualize datasets in ByMuR, users has to select necessary parameters:
-
Phenomenon
- Hazard Model
- Exposure Time
- Risk model (only if it is available for given hazard model and exposure time)
- Return period
- Intensity thresholds
Once button Update Map is pressed, dataset is retrieved from Bymur-DB and plot hazard and probability maps plotted on Map panel, upper right panel ByMuR main window. User can zoom, pan and examine plot using the navigation bar located under plot axis.
Curve visualization
To enable Curve panel two different selection modality can be used on maps:
-
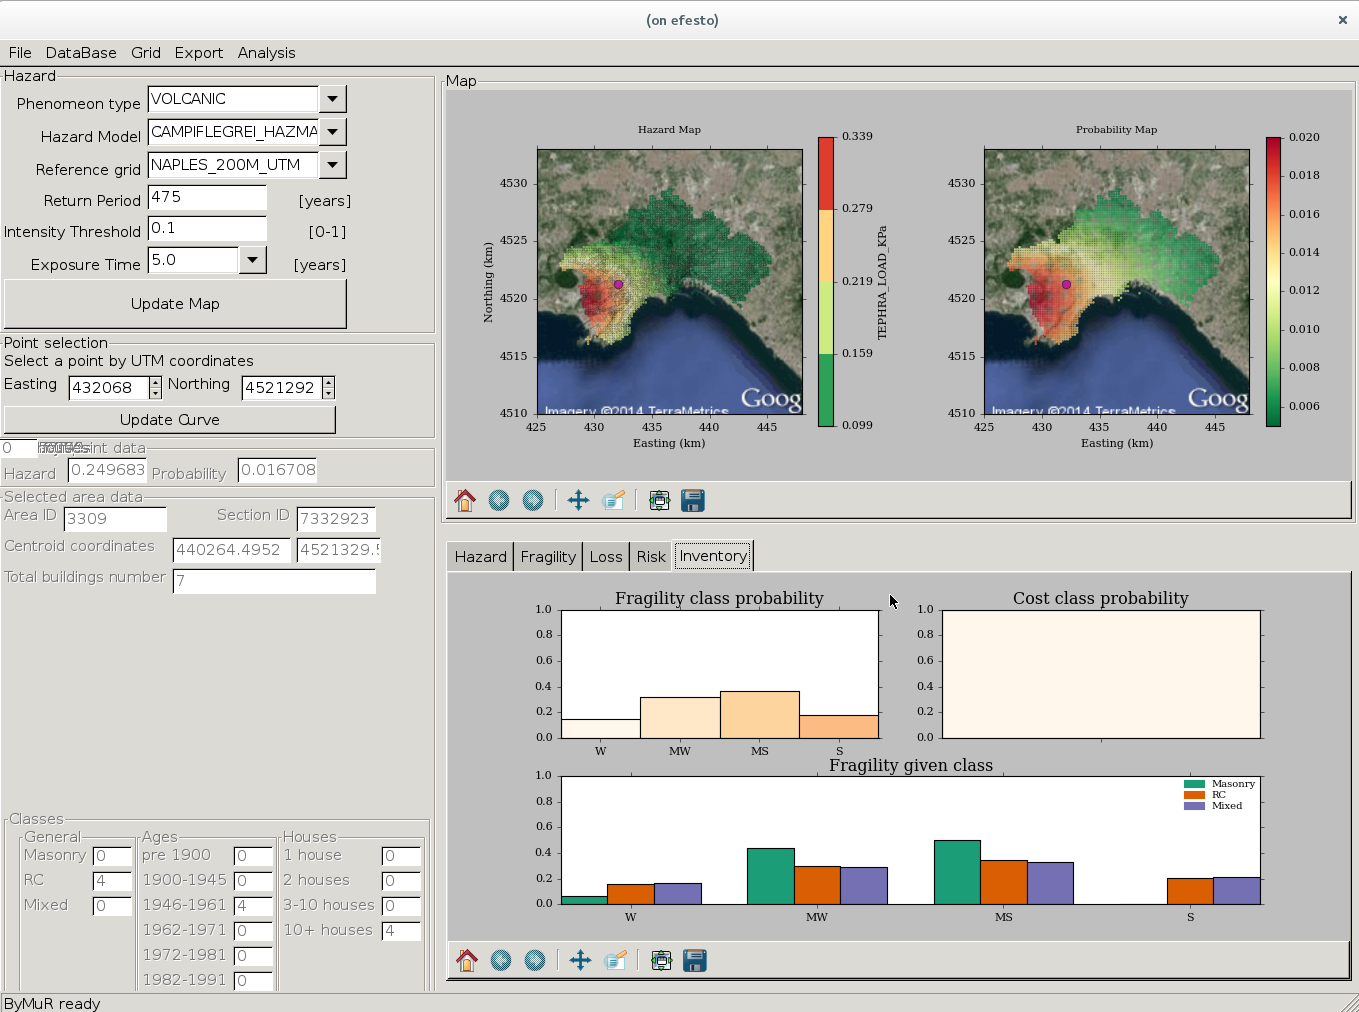
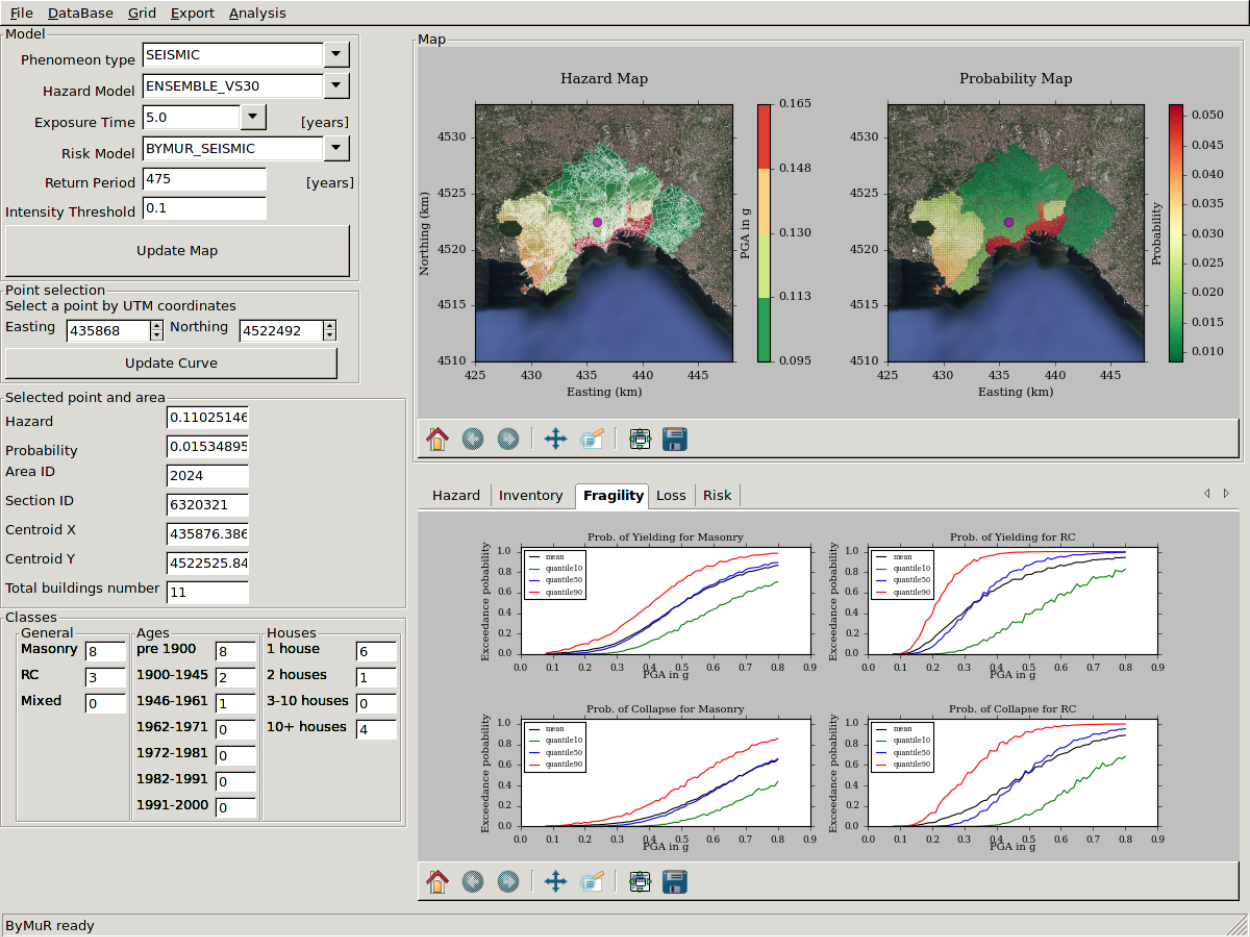
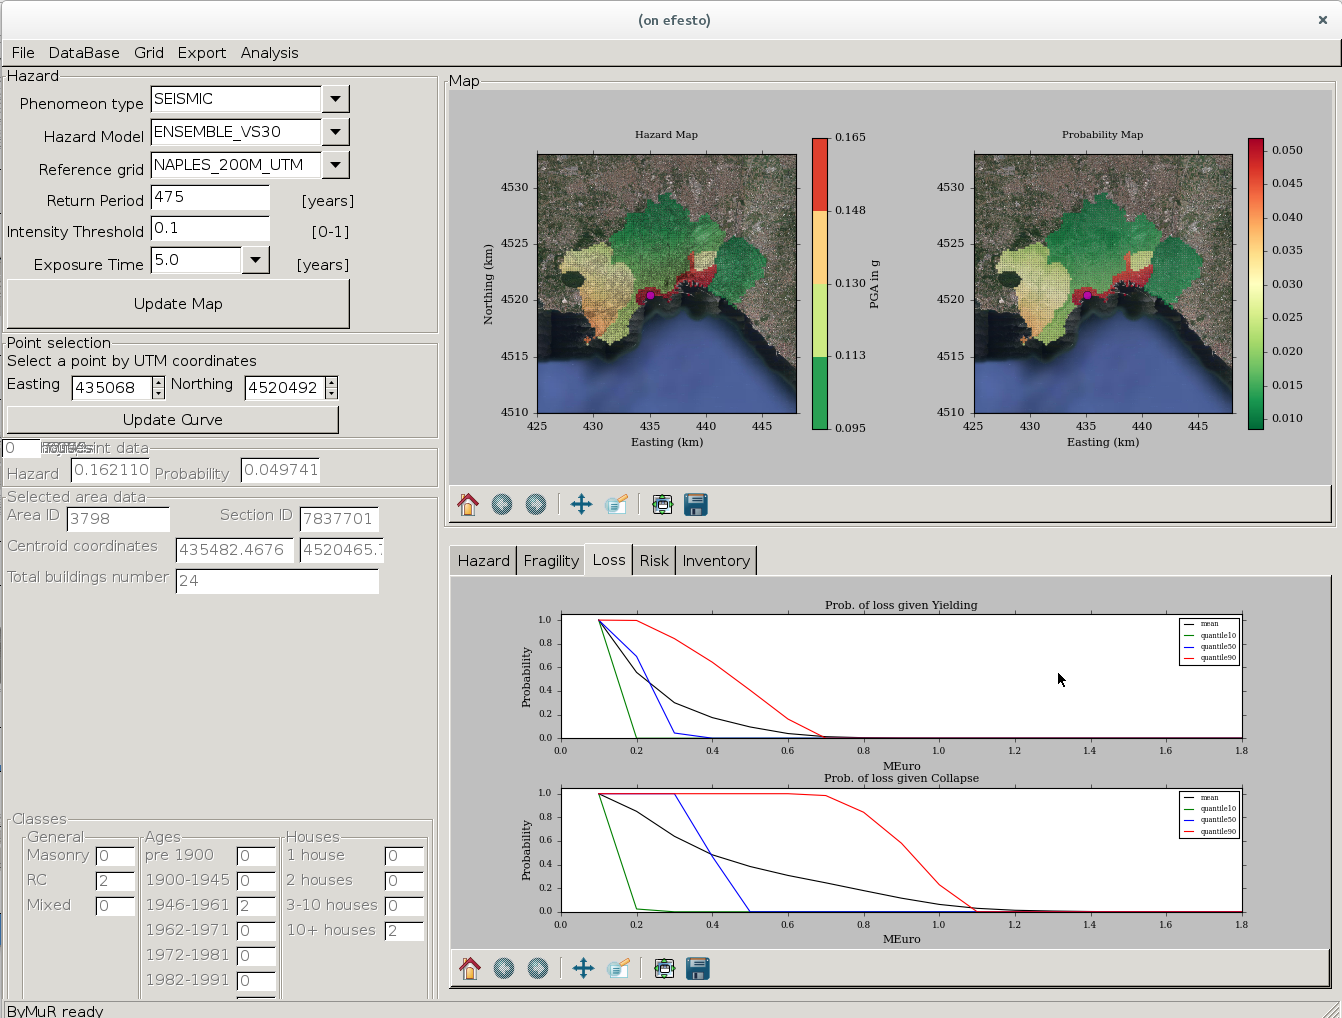
- point/single area selection by simply clicking on (or near) a sample point on maps, ByMuR will plot all curves defined for that point contained in ByMuR-DB and belonging to selected hazard model. If a risk model is defined for hazard, also fragility, loss, risk and inventory data for the selected area will be plotted.
- multiple areas selection by clicking and dragging the mouse on a map, user can select multiple areas. Resulting selection will contains all the areas intersecting rectangular selection done by the user. In this case only risk index plot will be shown, aggregating data contained in ByMuR-DB for highlighted areas.
In the curve panel can be visualized five kind of plots for any specific selected point of the spatial grid. They are, respectively, hazard curves, inventory classes, fragility curves, loss curves and risk indexes and curves (see figures).